

Crypto moves fast. Prices rise in minutes. Trends flip without warning. News spreads like wildfire. That’s why understanding cryptocurrency market analysis matters. It’s not about predicting the future with perfect accuracy. It’s about stacking the odds in your favor with data instead of emotion.
Many people jump into crypto with excitement, but they trade blindly. They follow hype instead of signals. They chase pumps or panic at dips. The result? Stress, mistakes, and losses. Learning how to read charts is how traders take back control.
This guide breaks things down in a simple, human way. No confusing jargon. No robotic explanations. Just clear principles you can use to analyze price trends, spot opportunities, and avoid traps.
What Is Cryptocurrency Market Analysis?
Cryptocurrency market analysis is the process of studying price data, behavior, and sentiment to understand where the market might move. It’s not just for professionals. Anyone can learn it. The goal isn’t perfection. The goal is clarity.
There are different types of analysis, and each one helps answer a different question:
Technical vs. Fundamental vs. Sentiment Analysis
Technical analysis (crypto) focuses on price charts and patterns.
It helps answer:
Where might the price go next?
When could a trend change?
When does momentum look weak or strong?
Fundamental analysis looks at the bigger picture:
Technology
Tokenomics
Utility
Macro conditions
Sentiment analysis studies crowd emotion and market psychology:
Fear, greed, hype, panic, confidence
Think of it like a 3-part system:
Fundamentals tell you why something matters.
Technicals tell you when to act.
Sentiment tells you how fast things can change.
Together, they create a stronger view.
Core Tools Used in Technical Analysis for Crypto
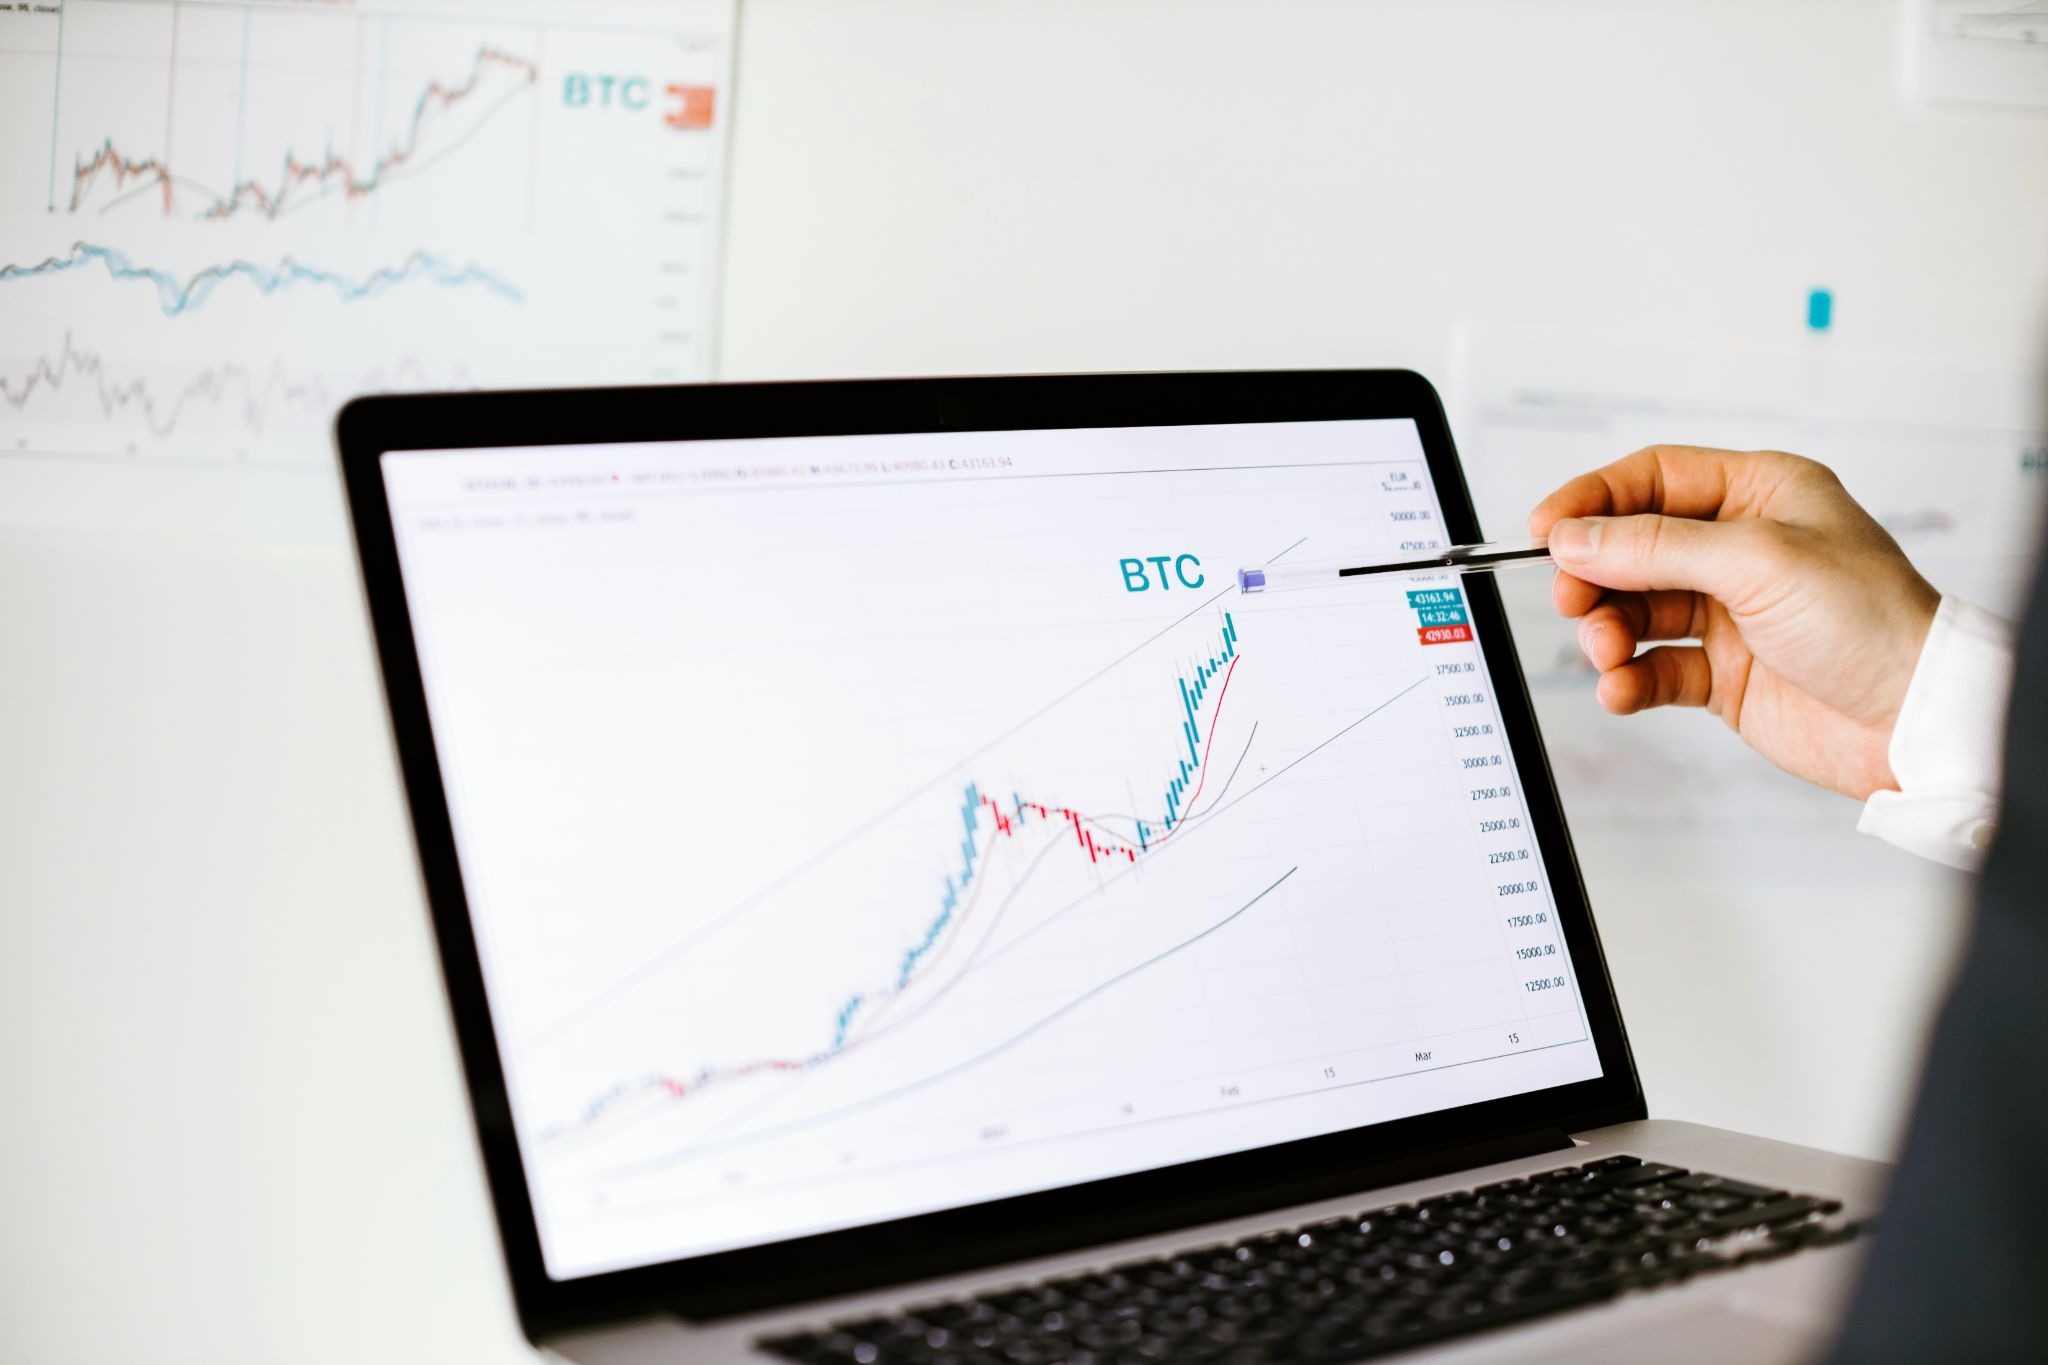
When analyzing crypto, charts are your starting point. They reveal price behavior. They show support, resistance, and patterns forming beneath the surface. Most traders use candlestick charts because they provide more detail than simple line charts.
Candlestick Basics and Why They Matter
A candlestick shows four key points within a time period:
Open
High
Low
Close
Red candles show downward pressure. Green candles show upward movement. But the size of the candle matters too. Long wicks can signal reversals. Tight candles indicate indecision.
Candlesticks help you see emotion without reading the news.
Support and Resistance Levels
Support is a price level buyers defend. Resistance is a level sellers protect.
If price keeps bouncing from the same area, it’s support. If price keeps rejecting a ceiling, that’s resistance.
Why it matters:
Breaking resistance often starts bullish momentum.
Losing support can trigger sell-offs.
These areas help traders decide where to enter or exit positions.
Crypto Chart Patterns That Help Predict Movements
Patterns don’t tell the future. They show probabilities. When you learn them, your decisions feel less like guessing and more like recognition.
Continuation Patterns
These patterns suggest a trend may continue:
Flags
Pennants
Ascending channels
When these form, price is often taking a breath before continuing.
Reversal Patterns
Reversals hint that momentum is shifting:
Head and shoulders
Double top or double bottom
Falling wedge or rising wedge
Reversals don’t always play out, but spotting them early gives you an edge.
Trendlines and Breakouts
Trendlines show the direction of the market. When price breaks a trendline with volume, it can signal a new path.
A breakout with low volume is suspicious. A breakout with rising volume feels stronger.
Indicators Traders Use to Predict Crypto Price Trends
Indicators are like weather instruments for the market. They don’t tell you what will happen. They tell you what conditions look like.
Moving Averages
These smooth out price noise and highlight trend direction.
50-day: short-term
100-day: medium-term
200-day: long-term
A golden cross (50-day crossing above 200-day) can suggest bullish energy.
A death cross signals the opposite.
RSI and Market Strength
The Relative Strength Index measures momentum.
Above 70: overbought (trend may cool down)
Below 30: oversold (trend may recover)
It helps identify if price has moved too far, too fast.
Volume and Breakouts
Volume confirms movement. Without it, trends weaken quickly.
If volume rises and price breaks a key level, traders pay attention.
Reading Market Sentiment and Momentum
Crypto isn’t always logical. Sometimes sentiment guides the chart more than patterns or data. That’s why monitoring emotions is part of market analysis.
Fear and Greed Cycles
During fear, prices fall, but opportunities appear.
During greed, prices rise, but risk increases.
When everyone feels the same way, the market often flips.
News and Narrative Shifts
News doesn’t create trends. It accelerates them.
Narratives change quickly:
Institutional interest
Regulations
Network upgrades
Partnerships
High-profile buys or sells
Timing matters. Reaction matters more.
Putting It All Together: A Practical Analysis Framework
A professional mindset doesn’t mean being perfect. It means being consistent. Even simple routines can make you a stronger trader.
Here’s a repeatable approach:
1. Scan the chart
Identify the trend direction.
2. Mark key levels
Support and resistance zones.
3. Look for validation
Patterns + volume + indicators.
4. Plan your action
Entry, target, exit, invalidation.
5. Manage risk
Stop-loss placement
Position sizing
No emotional chasing
Basic Risk Management Rules
Never go all-in.
Avoid trading out of boredom.
Use stops. Not hope.
Protect capital first; profits follow.
Common Mistakes Beginners Make
A few things hurt new traders again and again:
Chasing pumps
Panic selling at bottoms
Using too many indicators at once
Ignoring volume
Forgetting to check timeframes
Emotional revenge trading
If you avoid these, you’re already ahead of many newcomers.
FAQs
Q: Do crypto chart patterns really work?
They don’t guarantee anything. They suggest probabilities. Think of them as signals, not certainties.
Q: Is technical analysis crypto enough on its own?
No. It works best when combined with fundamentals and sentiment.
Q: Can beginners learn market analysis quickly?
Yes. Start simple and build slowly. Consistency matters more than speed.
Q: What timeframe should I trade on?
It depends. Short-term traders use lower charts. Long-term holders focus on higher timeframes.
Q: Are indicators always right?
Never. They are tools. You still need judgment.
Conclusion
Cryptocurrency market analysis is a skill anyone can learn. You don’t need to predict the future. You just need to understand what the market is showing you. When you read charts, patterns, and momentum signals together, the chaos starts to look like structure.
Remember:
Patterns show possibilities.
Indicators show conditions.
Sentiment shows speed.
Risk management protects your account.
Crypto rewards patience, discipline, and clarity. Not luck.